VYSHAKH VIMAL KUMAR
PORTFOLIO

Dedicated to transforming data into actionable insights and
helping businesses make informed decisions.
@Vyshakh21
.

Data-Driven Insights for Blinkit:
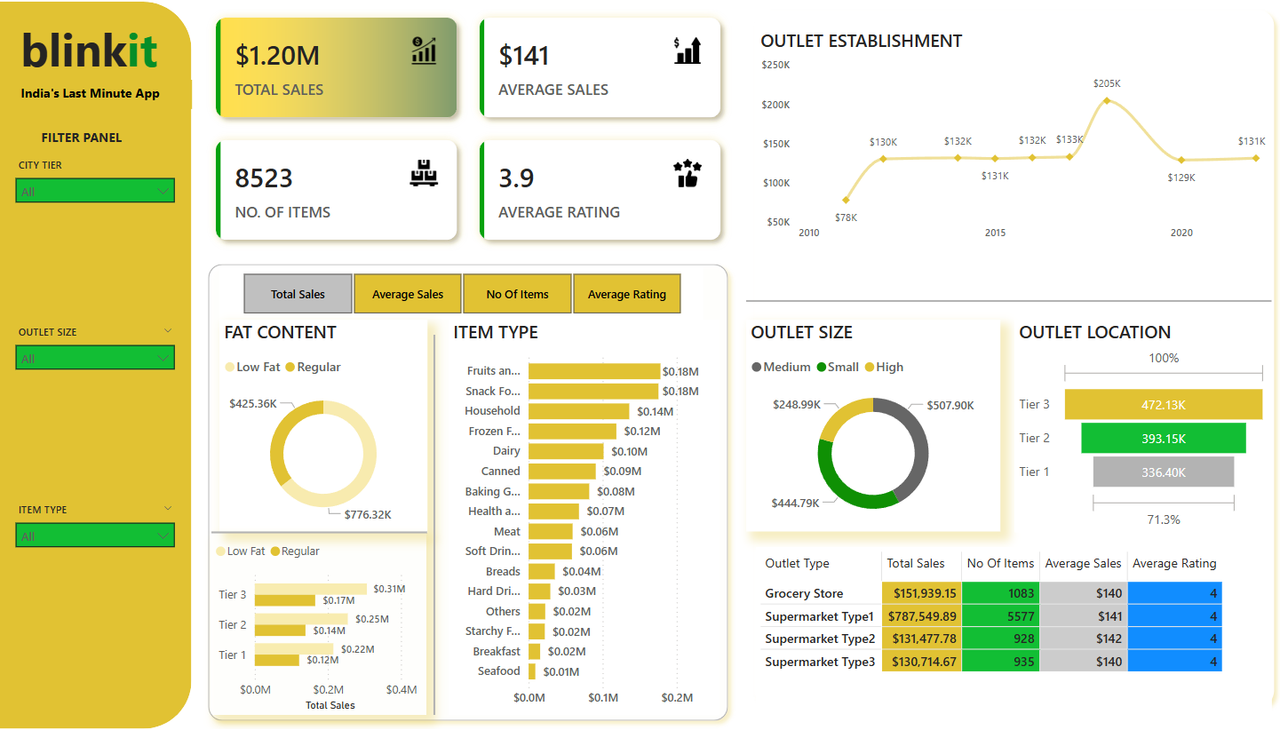
Interactive Sales Dashboard

Utilized Excel and Sql Server to derive actionable insights and developed an interactive dashboard using PowerBI.
Providing a clear visualization of sales data, pinpointing the regions with the highest sales performance.
The dashboard facilitates easy exploration of trends and supports strategic decision-making for the company's growth.

COVID-19:
DATA INSIGHTS

Analyzed COVID-19 data by loading an Excel file into SQL Server and deriving insights on death rates, new cases, total vaccinations, and more. Insights were then visualized in an interactive Tableau dashboard, providing a comprehensive view of the pandemic's impact to help inform decision-making.

Python
Sales Analysis

Python project that examines consumer behavior during the Diwali season. By analyzing factors like state, gender, amount spent, and occupation, it provides actionable insights into sales trends through interactive visualizations using libraries like pandas, matplotlib, and seaborn.

Location

Kerala,India,679303

Phone

+91 7034865106

Email

vyshakhvimal@gmail.com

Social